| Essential Question:
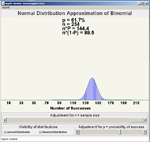
Assuming an SRS and given equal
sized margins of error, is the sample size required to survey the
entire United States substantially larger than the one for
conducting the same survey in Greenville SC? |
Two-Sample Proportions
-
Calculate the desired
sample size for a given margin of error in a proportion (p. 696).
Remember that p = 50% will give the max
sample size and hence most conservative estimate of the size needed.
Using the equation for margin of error, solve for n.
Relevance:
Survey results are a ubiquitous feature of newspaper and
magazine articles as well as political arguments.
The above is the basic way that surveys are designed.
- Create a confidence
interval for comparing two sample proportions.
| Margin of Error
for Confidence Interval |
| ME = |
z* [ p̂1(1-p̂1) /n1 + p̂2(1-p̂2) /n2 ]0.5 |
|
- State the Ho used for
comparing two sample proportions.
Ho:
p2 - p1 = 0
or
Ho:
p2 = p1
-
Calculate the pooled
portion of successes using both samples.
Pooled tests are generally run when testing 2 proportions because the
subjects are typically selected from a common pool but receive
different treatments--example: drug tests, heart attacks vs. fat in
diet, accident rate vs. drunkenness, etc. In all these examples, the
human subjects are typically drawn from the same population.
|
pc |
= |
count of successes in both samples combined
|
|
count of observations in both samples combined |
|
|
|
|
|
= |
X1 + X2 |
| n1
+ n2 |
-
Perform a hypothesis test
for comparing two sample proportions.
Note: the TI-83 calculator automatically does a
pooled test when the 2-PropZTest option is selected
| Test Statistic for
Hypothesis Testing |
| z = |
(p̂1- p̂2)
- 0
|
| [ p̂c(1-p̂c) /n1 + p̂c(1-p̂c) /n2 ]0.5 |
|
Homefun
(formative/summative assessment):
Read 10.1, Exercises 1, 3, 7, 9, 13
pp. 621 to 623
| Essential Question: How What is the standard error (standard deviation of the sampling distribution) for the difference between 2 means when population std deviations are known? |
- State that the sampling distribution mean for the difference between samples drawn from two different populations is the same as the difference between the the two population means.
In other words,
the mean of the sampling distribution for ( x-bar1 - x-bar2 ) is ( μ1 - μ2 )
- Given the standard deviations of 2 different populations, calculate the standard error for the sampling distribution of the difference between the two means.
| SE = |
( σ12/ n1 + σ22/ n2 ) 0.5 |
Homefun (formative/summative assessment):
Read 10.2, Exercises
35, 37 p. 652
| Essential Question: How can you determine if 2
populations differ if at the start you have no information? |
Two-Sample t-Test
-
State the assumptions made
for two-sample tests. (p. 650)
SRS used for generating the
sample
independent - matched pairs violate independence
normally
distributed population
-
Create confidence intervals
and hypothesis test using two sample t procedures assuming that the
sigmas of the two populations are unequal. This is the most
conservative assumption.
Ho: μ1 - μ2 = 0 but can also
be written, Ho: μ1 = μ2
| Test Statistic for
Hypothesis Testing |
Margin of Error
for Confidence Interval |
| t = |
(xbar1 - xbar2)
- 0
|
| (s12/n1 + s22/n2)0.5 |
|
| ME = |
t* (s12/n1 + s22/n2) 0.5 |
|
-
Create confidence intervals
and hypothesis test using two sample t procedures and the most
conservative method of determining df.
df = (the lower of n1 -1
or n2 - 1)
-
Be aware of the more
accurate way to calculate df as is done by the TI-83 calculator. This method can return a df that includes a decimal fraction. For example: df = 12.37
-
Perform two sample
hypothesis t-procedures on the TI-83.
-
State the key assumption
required for using the pooled two-sample t-procedures. This is the method is an option in the TI-83
calculator.
The sigmas of the two populations are
the same
Homefun
(formative/summative assessment): Exercises
39,
43, 47, 45, 67, 69, 71, 75 pp. 652 to 660
Chapter 10 AP Statistics Practice Test multiple choice and free response pp. 664 to 666
|
