|
|
Benford's Law Part 2 - The
80/20 Rule or Pareto Principle |
|
|
Benford's
law is useful in detecting fraudulent accounting data but may also have
a wider meaning if the digits it evaluates are considered ranks or
places. For example the digits 1,2,3,...9 could be considered as
representing first through ninth place in a contest The digit's probability
of occurring could be considered the relative share of total winnings for
each place. In other words, 1st place would win 30.1%, 2nd place 17.6%, 3rd
12.5%,... 9th place 4.6% of the available rewards.
Benford's
law enables fraud detection in accounting data because the probability of
getting a 1 for the first digit of a number is 30.1% instead of 11% r 1/9 as would
normally be expected. The probability of obtaining any of the possible first digits 1
through 9 is
calculated as follows:
P = Log10 (1+1/n)
eqn 1.
where: n = digit
For other number bases Benford's law becomes:
|
|
|
|
|
|
| P |
= |
Log10 (n+1) - Log10 n |
|
|
| Log10 B |
|
|
|
|
|
|
|
= |
Log10
(1+1/n) |
|
eqn 2. |
| Log10 B |
|
|
|

|
|
where: B = number base
Figure 1 shows the probability of obtaining various first
digits for different number bases. This could potentially be used as a model
for ranked data sets of different sizes. In this case each digit would
represent a ranked data point. For instance, we could model contributions to
a charity such as the Red Cross. If 3 contributions are made to
the Red cross we would use the base 4 curve. Presumably the number one or
largest donation would be about 50% of the total. The second highest would
be 29.2 % of the total and the third 20.8% (see Table 1). If 9 donations are made,
the highest one should be about 30 % of the total the second 18.5% and so
on. This is interesting food
for thought but not likely to be useful as a predictive model, at least for
small sized data sets. In these cases random errors could easily overwhelm a
correlation between the data points and the model.
|
|
If we normalize the curve for each number base by dividing
the individual values by the first value, something amazing
happens. The various curves merge into a single number base independent curve. For example the first value of the base 4 curve is 50% and
the second is 29.2%.
(29.25%)/(50%) = 58.5%
The second value divided by the first value gives 58.5 %
for every curve regardless of the base! Table 1 shows the original values.
Table 2 shows normalized data in which each value for a given base has been
divided by the first value. Again, notice that the different curves have merged
into a number base independent curve. This curve indicates that each ranked value has
a defined percentage of the first or largest value.
We can derive an equation for this curve by dividing eqn 2
by the first value:
| P |
= |
Log10
(1+1/n) |
|
|
Log10 B |
| Log10
(1+1/1) |
|
| Log10 B |
|
|
|
|
|
| P |
= |
Log10
(1+1/n) |
|
eqn 3. |
| Log10 2 |
|
|
The normalized Benford curve (see Figure 2) could be used as a model for ranked data such
as the wealth of individuals in a country. In this case the second richest person in a
country should have about 58% of the first person's wealth. The third
richest person would have about 41.5% of the first persons wealth and so
on. Since n can be any size, the normalized Benford curve could model a
nation of any size, even a nation with billions of people. This model
obviously indicates that most of a country's wealth would be controlled by a
few individuals.
|
|
Table 1: Percent of Total by Rank Using
Benford's Law
|
| Rank |
Base |
| 2 |
3 |
4 |
5 |
6 |
7 |
8 |
9 |
10 |
| 1 |
100 |
63.1 |
50.0 |
43.1 |
38.7 |
35.6 |
33.3 |
31.5 |
30.1 |
| 2 |
|
36.9 |
29.2 |
25.2 |
22.6 |
20.8 |
19.5 |
18.5 |
17.6 |
| 3 |
|
|
20.8 |
17.9 |
16.1 |
14.8 |
13.8 |
13.1 |
12.5 |
| 4 |
|
|
|
13.9 |
12.5 |
11.5 |
10.7 |
10.7 |
9.7 |
| 5 |
|
|
|
|
10.2 |
9.4 |
8.8 |
8.3 |
7.9 |
| 6 |
|
|
|
|
|
7.5 |
7.4 |
7.0 |
6.7 |
| 7 |
|
|
|
|
|
|
6.4 |
6.1 |
5.8 |
| 8 |
|
|
|
|
|
|
|
5.4 |
5.1 |
| 9 |
|
|
|
|
|
|
|
|
4.6 |
|
|
Table 1: Percent of First Rank by Rank
Using Benford's Law
|
| Rank |
Base
|
| 2 |
3 |
4 |
5 |
6 |
7 |
8 |
9 |
10 |
| 1 |
100 |
100 |
100 |
100 |
100 |
100 |
100 |
100 |
100 |
| 2 |
|
58.5 |
58.5 |
58.5 |
58.5 |
58.5 |
58.5 |
58.5 |
58.5 |
| 3 |
|
|
41.5 |
41.5 |
41.5 |
41.5 |
41.5 |
41.5 |
41.5 |
| 4 |
|
|
|
32.2 |
32.2 |
32.2 |
32.2 |
32.2 |
32.2 |
| 5 |
|
|
|
|
26.3 |
26.3 |
26.3 |
26.3 |
26.3 |
| 6 |
|
|
|
|
|
22.2 |
22.2 |
22.2 |
22.2 |
| 7 |
|
|
|
|
|
|
19.3 |
19.3 |
19.3 |
| 8 |
|
|
|
|
|
|
|
17.0 |
17.0 |
| 9 |
|
|
|
|
|
|
|
|
15.2 |
|
|
In 1906 the Italian economist Vilfredo Pareto (1848-1923) determined that about 80% of Italy's wealth was
controlled by about 20% of the people. This has evolved into the 80/20 Rule or
Pareto principle which is frequently applied to business or quality control
problems. For example: 20% of the employees do 80% of the work or 20% of the
quality problems account for 80% of the rejects. This is only a rule of thumb since
actual proportions are rarely exactly 20% and 80%. However, it's a very
useful rule of thumb.
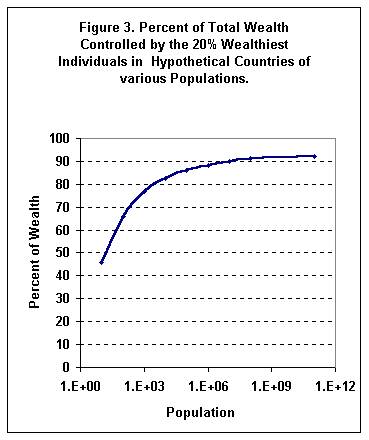
To determine if the Benford model gives results similar to
those of the Pareto principle we use the normalized Benford
equation in a computer program. This calculates the percent of the total
wealth controlled by the top 20% of the most wealthy individuals in
hypothetical countries of various sizes. Figure 3 shows the results. Based
on this figure we would derive a 90/20 rule instead of an 80/20 rule.
However, the result is still strikingly similar to Pareto's findings.
If we total the GDP's (a measure of wealth) of the nations
with the top 20% of world's per capita GDP's (most wealthy people) we get a
similar finding. 20% of the world's people control 85% of the wealth. This
is based on countries in which the GDP can be estimated. These countries
account for about 5.8 billion people. The 85% figure is probably low since
there is no data for some of the poorest countries. Also using per capita
GDP ignores the fact that some of the world's richest people live in poor
countries and some poor people live in wealthy countries. Again the
agreement with the normalized Benford's model is surprisingly good and
suggests that a 90/20 rule may describe the distribution of wealth in
the world better than the 80/20 rule.
The correlation between the Benford model and wealth raises interesting questions. For example it implies that an increase in the
discrepancy between the rich and poor may be a natural outcome of an
increase in population. The model casts doubt on whether anything can
realistically be done
to eliminate the huge variability in wealth. According to the model, the
wealth of the poor moves up and down with the wealth of the rich. Certainly, attempts to redistribute wealth
using various communist systems have not been overly successful. They have
tended to impoverish rich and poor alike.
|
|

|
|
|
|
|
The key weakness of the Benford model lies in the fact that
it is dependent on a single data point, namely the first or highest value.
All other values are divided by the first one. Random error in this number could give a poor fit between the Benford model
and a set of ranked data. A constant can be used to compensate for errors in the first value.
Using this method, the Benford's model would become:
|
|
|
|
|
P |
= |
k(Log10
(1+1/n)) |
|
|
|
|
|
where: k = an experimentally
developed constant |
|
|
|
|
|
|
Unlike some correlation models, the Benford model is derived
from basic principles. The fact that the model appears to correlate with a
particular data set, however, may be pure coincidence, but it certainly raises
interesting questions about the possibility of an underlying order.
< Return to Contents |
|
|
|